 Dear guest, you are not a registered member. As a guest, you only have read-only access to our books, tests and other practice materials.
As a registered member you can:
- View all solutions for free
- Request more in-depth explanations for free
- Ask our tutors any math-related question for free
- Email your homework to your parent or tutor for free
Registration is free and doesn't require any type of payment information. Click here to
Register.
Grade 6 McGraw Hill Glencoe - Answer Keys
Chapter 12:Statistical Display;Lesson 1:Line Plots
Please share this page with your friends on FaceBook
Guided Practice |
-
Question 1
 (request help) (request help)
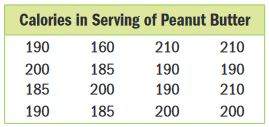
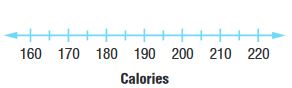
Make a line plot for the set of data. Describe the data. Include measures of center and variability.
|
-
Question 2
(request help)
Building on the Essential Question How is using a line plot useful to analyze data?
Type below:
|
 (show solution)