 Dear guest, you are not a registered member. As a guest, you only have read-only access to our books, tests and other practice materials.
As a registered member you can:
- View all solutions for free
- Request more in-depth explanations for free
- Ask our tutors any math-related question for free
- Email your homework to your parent or tutor for free
Registration is free and doesn't require any type of payment information. Click here to
Register.
Grade 6 McGraw Hill Glencoe - Answer Keys
Chapter 12:Statistical Display;Lesson 5:Interpret Line Graphs
Please share this page with your friends on FaceBook
-
Question 12
 (request help) (request help)
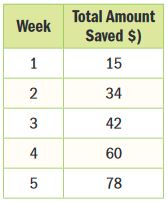
The table shows the amount of money Kailey has saved after 5 weeks. Construct a line graph of the data.

Predict how much Kailey will have saved after Week 8.
-
|
-
Question 13
 (request help) (request help)
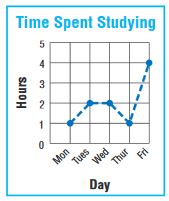
The graph shows the amount of time Mia spent studying last week.
Determine if each statement is true or false.

a. The amount of time increased the most from Thursday to Friday.
-
-
|
-
Question 13
 (request help) (request help)
b. Mia spent the same amount of time studying on Monday and Wednesday.
-
-
|
-
Question 13
 (request help) (request help)
c. The amount of time decreased from Monday to Tuesday.
-
-
|
Spiral Review
Find the greatest number in the set. |
|
|
|
|
Find the total of the set of numbers |
|
|
|
|
-
Question 20
 (request help) (request help)
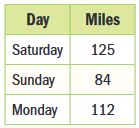
The table shows the miles the Smythe family traveled each day. What is the total number of miles they traveled?

-
|
-
Question 21
 (request help) (request help)
Selena can make 24 cookies in 30 minutes. At this rate, how many cookies can she make in 90 minutes?
-
|
 Dear guest, you are not a registered member. As a guest, you only have read-only access to our books, tests and other practice materials.