 Dear guest, you are not a registered member. As a guest, you only have read-only access to our books, tests and other practice materials.
As a registered member you can:
- View all solutions for free
- Request more in-depth explanations for free
- Ask our tutors any math-related question for free
- Email your homework to your parent or tutor for free
Registration is free and doesn't require any type of payment information. Click here to
Register.
Grade 7 McGraw Hill Glencoe - Answer Keys
Please share this page with your friends on FaceBook
Independent Practice |
-
Question 1
 (request help) (request help)
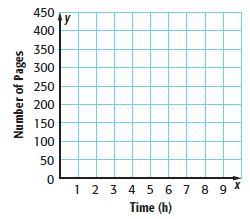
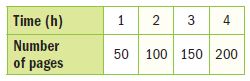
The table shows the number of pages Adriano read in x hours. Graph the data. Then find the slope of the line. Explain what the slope represents.
-
-
-
-
-
-
|
-
Question 2
(request help)
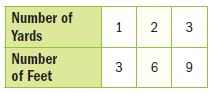
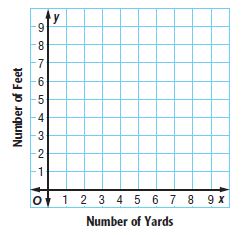
Graph the data. Find the numerical value of the slope and interpret it in words.
-
-
-
-
-
-
|
-
Question 3
(request help)
The graph shows the average speed of two cars on the highway.
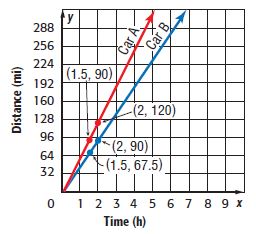
a. What does (2, 120) represent?
Type below:
|
-
Question 3
(request help)
b. What does (1.5, 67.5) represent?
Type below:
|
-
Question 3
(request help)
c. What does the ratio of the y-coordinate to the x-coordinate for each pair of points on the graph represent?
Type below:
|
-
Question 3
(request help)
d. What does the slope of each line represent?
Type below:
|
-
Question 3
(request help)
e. Which car is traveling faster? How can you tell from the graph?
-
|
 (show solution)