 Dear guest, you are not a registered member. As a guest, you only have read-only access to our books, tests and other practice materials.
As a registered member you can:
- View all solutions for free
- Request more in-depth explanations for free
- Ask our tutors any math-related question for free
- Email your homework to your parent or tutor for free
Registration is free and doesn't require any type of payment information. Click here to
Register.
Grade 7 McGraw Hill Glencoe - Answer Keys
Chapter 10: Statistics; Lesson 4: Compare Populations
Please share this page with your friends on FaceBook
Standardized Test Practice |
-
Question 12
 (request help) (request help)
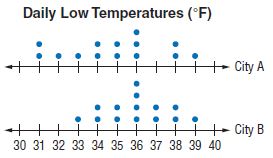
The double dot plot below shows the daily low temperatures of two cities in January.

Which of the following statements about the two populations is true?
-
-
-
-
|
Common Core Review
Find the mean absolute deviation of each set of data. Round to the nearest hundredth if necessary. |
|
|
|
-
Question 15
 (request help) (request help)
Refer to the graph in Exercise 2. Describe the shape of the distribution of the data for Airjet Express
Type below:
|
-
Question 16
 (request help) (request help)
Refer to the graph in Exercise 10. Describe the shape of the distribution of the data for Canyon Overlook.
Type below:
|
 Dear guest, you are not a registered member. As a guest, you only have read-only access to our books, tests and other practice materials.