×
Dear guest, you are not a registered member . As a guest, you only have read-only access to our books, tests and other practice materials.
As a registered member you can:
View all solutions for free
Request more in-depth explanations for free
Ask our tutors any math-related question for free
Email your homework to your parent or tutor for free
Registration is free and doesn't require any type of payment information. Click here to
Register .
Grade 5 HMH Go Math - Answer Keys
Chapter 9 Review/Test
Please share this page with your friends on FaceBook
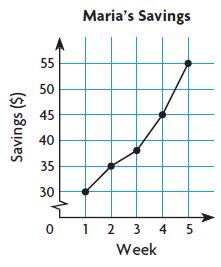
Each week, Maria saves some of her allowance. The line graph shows the amount of Maria’s savings for the first 5 weeks of the year.
For 9a–9b, select True or False for each statement.
Question 9
a. Maria’s savings increased from $30 to $55 over the 5-week period.
Question 9
b. The greatest increase in Maria’s savings occurred from Week 1 to Week 2.
Question 10
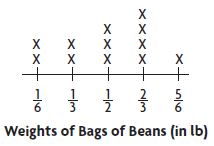
The line plot shows the weights of bags of beans. What is the average weight of the bags? Show your work.
Average weight:
lb.
Question 11
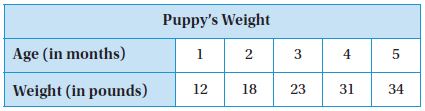
The table shows how much a puppy weighs from 1 month old to 5 months old.
What ordered pairs would you plot to show the puppy’s weight on a coordinate grid? How do you think the ordered pairs would be different if the puppy’s weight was measured every week instead of every month? Explain your reasoning.
Type below:
 Dear guest, you are not a registered member. As a guest, you only have read-only access to our books, tests and other practice materials.
 (request help)
 (show solution)