×
Dear guest, you are not a registered member . As a guest, you only have read-only access to our books, tests and other practice materials.
As a registered member you can:
View all solutions for free
Request more in-depth explanations for free
Ask our tutors any math-related question for free
Email your homework to your parent or tutor for free
Registration is free and doesn't require any type of payment information. Click here to
Register .
Grade 6 HMH Go Math - Answer Keys
Please share this page with your friends on FaceBook
Share and Show
Question 1
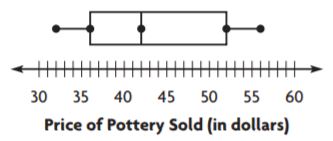
Find the range and interquartile range of the data in the box plot.
Practice : Copy and Solve
Question 2
heights in inches of several tomato plants:
16, 18, 18, 20, 17, 20, 18, 17
Question 3
times in seconds for students to run one lap:
68, 60, 52, 40, 64, 40
On Your Own
Use the box plot for 4 and 5.
Question 5
What is the interquartile range of the data?
Practice : Copy and Solve
Question 6
times in minutes spent on a history quiz:
35, 35, 32, 34, 34, 32, 34, 36
Question 7
number of excused absences for one semester:
1, 2, 1, 10, 9, 9, 10, 6, 1, 1
Question 8
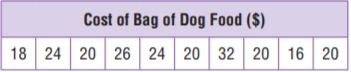
The chart shows the price of different varieties of dog food at a pet store. Find the range, interquartile range, and the mean absolute deviation of the data set.
Type below:
 Dear guest, you are not a registered member. As a guest, you only have read-only access to our books, tests and other practice materials.
 (request help)
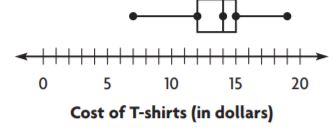
 (show solution)