 Dear guest, you are not a registered member. As a guest, you only have read-only access to our books, tests and other practice materials.
As a registered member you can:
- View all solutions for free
- Request more in-depth explanations for free
- Ask our tutors any math-related question for free
- Email your homework to your parent or tutor for free
Registration is free and doesn't require any type of payment information. Click here to
Register.
Grade 6 HMH Go Math - Answer Keys
Please share this page with your friends on FaceBook
Lesson Check |
-
Question 1
 (request help) (request help)
Daily high temperatures recorded in a certain city are 65°F, 66°F, 70°F, 58°F, and 61°F. What is the mean absolute deviation for the data?
-
|
-
Question 2
(request help)
Eight different cereals have 120, 160, 135, 144, 153, 122, 118, and 134 calories per serving. What is the interquartile range for the data?
-
|
Spiral Review |
-
Question 3
(request help)
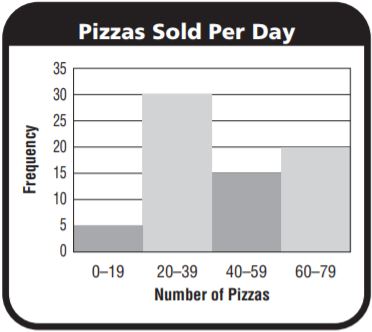
Look at the histogram. How many days did the restaurant sell more than 59 pizzas?
-
|
-
Question 4
(request help)
Look at the histogram. Where does a peak in the data occur?
Type below:
|
-
Question 5
(request help)
What is the mode of the data set?
14, 14, 18, 20
-
|
-
Question 6
(request help)
The data set below lists the ages of people on a soccer team. The mean of the data is 23. What is the mean absolute deviation?
24, 22, 19, 19, 23, 23, 26, 27, 24
-
|
 (show solution)