×
Dear guest, you are not a registered member . As a guest, you only have read-only access to our books, tests and other practice materials.
As a registered member you can:
View all solutions for free
Request more in-depth explanations for free
Ask our tutors any math-related question for free
Email your homework to your parent or tutor for free
Registration is free and doesn't require any type of payment information. Click here to
Register .
Grade 6 HMH Go Math - Answer Keys
Please share this page with your friends on FaceBook
Question 12
Yasmine keeps track of the number of hockey goals scored by her school’s team at each game. The dot plot shows her data.
Where is there a gap in the data?
Type below:
Question 13
What is the interquartile range of the data shown in the dot plot with Question 12?
Question 14
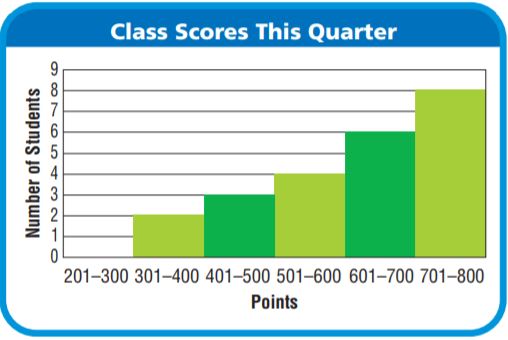
Randall’s teacher added up the class scores for the quarter and used a histogram to display the data. How many peaks does the histogram have? Explain how you know.
Type below:
Question 15
In a box plot of the data below, where would the box be drawn?
55, 37, 41, 62, 50, 49, 64
Type below:
 Dear guest, you are not a registered member. As a guest, you only have read-only access to our books, tests and other practice materials.
 (request help)
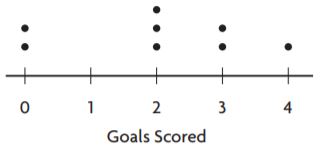
 (show solution)