 Dear guest, you are not a registered member. As a guest, you only have read-only access to our books, tests and other practice materials.
As a registered member you can:
- View all solutions for free
- Request more in-depth explanations for free
- Ask our tutors any math-related question for free
- Email your homework to your parent or tutor for free
Registration is free and doesn't require any type of payment information. Click here to
Register.
Grade 5 HMH Go Math - Answer Keys
Chapter 9; Lesson 4:Line Graphs
Please share this page with your friends on FaceBook
Line Graphs
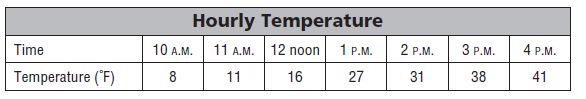
Use the table for 1–5.
|
-
Question 1
 (request help) (request help)
Write the related number pairs for the hourly temperature as ordered pairs.
(10,8);
-
|
-
Question 2
(request help)
What scale would be appropriate to graph the data?
-
|
-
Question 3
(request help)
What interval would be appropriate to graph the data?
-
|
|
|
-
Question 5
(request help)
Use the graph to find the difference in temperature between 11 A.M. and 1 P.M.
-
|
Problem Solving |
-
Question 6
(request help)
Between which two hours did the least change in temperature occur?
-
|
-
Question 7
(request help)
What was the change in temperature between 12 noon and 4 P.M.?
-
|
 (show solution)