 Dear guest, you are not a registered member. As a guest, you only have read-only access to our books, tests and other practice materials.
As a registered member you can:
- View all solutions for free
- Request more in-depth explanations for free
- Ask our tutors any math-related question for free
- Email your homework to your parent or tutor for free
Registration is free and doesn't require any type of payment information. Click here to
Register.
Grade 6 HMH Go Math - Answer Keys
Please share this page with your friends on FaceBook
Share and Show
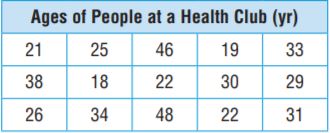
For 1–4, use the data at right.
|
-
Question 1
 (request help) (request help)
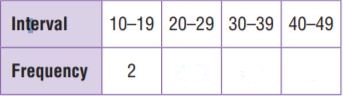
Complete the frequency table for the age data in the table at right.
Type below:
|
-
Question 2
(request help)
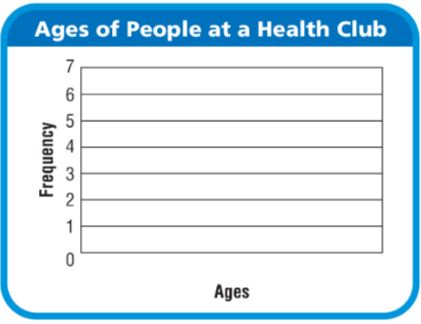
Complete the histogram for the data.
Type below:
|
-
Question 3
(request help)
Use your histogram to find the number of people at the health club who are 30 or older.
-
|
-
Question 4
(request help)
Use your histogram to determine the percent of the people at the health club who are 20–29 years old.
-
|
On Your Own
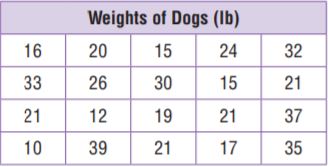
Practice: Copy and Solve For 5–7, use the table.
|
-
Question 5
(request help)
Make a histogram of the data using the intervals 10–19, 20–29, and 30–39.
Type below:
|
-
Question 6
(request help)
Make a histogram of the data using the intervals 10–14, 15–19, 20–24, 25–29, 30–34, and 35–39.
Type below:
|
-
Question 7
(request help)
Compare Explain how using different intervals changed the appearance of your histogram.
Type below:
|
 (show solution)