 Dear guest, you are not a registered member. As a guest, you only have read-only access to our books, tests and other practice materials.
As a registered member you can:
- View all solutions for free
- Request more in-depth explanations for free
- Ask our tutors any math-related question for free
- Email your homework to your parent or tutor for free
Registration is free and doesn't require any type of payment information. Click here to
Register.
Grade 6 HMH Go Math - Answer Keys
Please share this page with your friends on FaceBook
Problem Solving + Applications
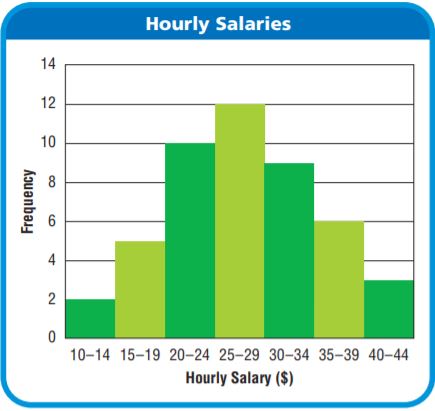
The histogram shows the hourly salaries, to the nearest dollar, of the employees at a small company. Use the histogram to solve 8–11.
|
-
Question 8
 (request help) (request help)
How many employees make less than $20 per hour?
-
|
-
Question 9
(request help)
How many employees work at the company? Explain how you know.
-
|
-
Question 10
(request help)
Pose a Problem Write and solve a new problem that uses the histogram.
Type below:
|
-
Question 11
(request help)
Analyze Describe the overall shape of the histogram. What does this tell you about the salaries at the company?
Type below:
|
-
Question 12
(request help)
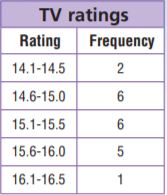
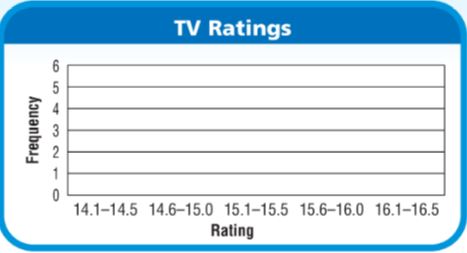
The frequency table shows the TV ratings for the show American Singer. Complete the histogram for the data.
Type below:
|
 (show solution)