 Dear guest, you are not a registered member. As a guest, you only have read-only access to our books, tests and other practice materials.
As a registered member you can:
- View all solutions for free
- Request more in-depth explanations for free
- Ask our tutors any math-related question for free
- Email your homework to your parent or tutor for free
Registration is free and doesn't require any type of payment information. Click here to
Register.
Grade 6 HMH Go Math - Answer Keys
Please share this page with your friends on FaceBook
Histograms
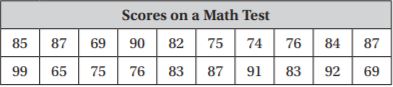
For 1–4 use the data at right.
|
-
Question 1
 (request help) (request help)
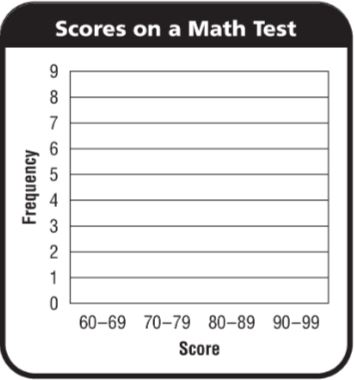
Complete the histogram for the data.
Type below:
|
-
Question 2
(request help)
What do the numbers on the y-axis represent?
Type below:
|
|
|
-
Question 4
(request help)
Use your histogram to find the number of students who got a score of 80 or greater. Explain.
-
|
Problem Solving
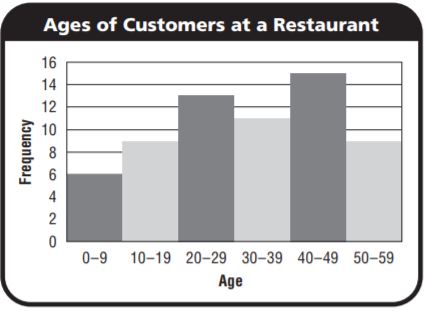
For 5–6, use the histogram.
|
-
Question 5
(request help)
For which two age groups are there the same number of customers?
Type below:
|
-
Question 6
(request help)
How many customers are in the restaurant? How do you know?
-
|
-
Question 7
(request help)
Write a letter to another student that explains how to make a histogram and what type of data a histogram displays.
Type below:
|
 (show solution)