×
Dear guest, you are not a registered member . As a guest, you only have read-only access to our books, tests and other practice materials.
As a registered member you can:
View all solutions for free
Request more in-depth explanations for free
Ask our tutors any math-related question for free
Email your homework to your parent or tutor for free
Registration is free and doesn't require any type of payment information. Click here to
Register .
Grade 6 HMH Go Math - Answer Keys
Please share this page with your friends on FaceBook
Lesson Check
Question 1
Chloe used two box plots to display some data. The box in the plot for the first data set is wider than the box for the second data set. What does this say about the data?
Type below:
Question 2
Hector recorded the temperature at noon for 7 days in a row. The temperatures are 20°F, 20°F, 20°F, 23°F, 23°F, 23°F, and 55°F. Which measure of center would best describe the data?
Type below:
Spiral Review
Question 3
By how much does the median of the following data set change if the outlier is removed?
13, 20, 15, 19, 22, 26, 42
Type below:
Question 4
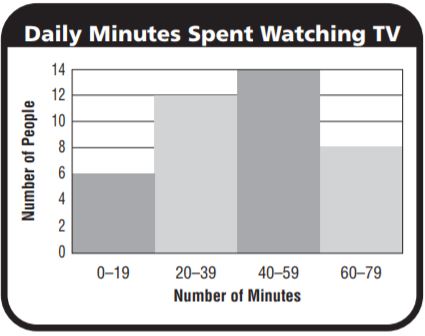
What percent of the people surveyed spent at least an hour watching television?
Question 5
What is the lower quartile of the following data?
12, 9, 10, 8, 7, 12
Question 6
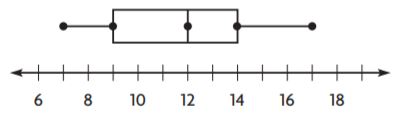
What is the interquartile range of the data shown in the box plot?
 Dear guest, you are not a registered member. As a guest, you only have read-only access to our books, tests and other practice materials.
 (request help)
 (show solution)