Make Arguments Jason collected data about the number of songs his classmates bought online over the past 3 weeks. Does the data set have symmetry? Why or why not?
Trinni surveyed her classmates about how many siblings they have. A dot plot of her data increases from 0 siblings to a peak at 1 sibling, and then decreases steadily as the graph goes to 6 siblings. How is Trinni’s dot plot similar to Jason’s? How is it different?
 Dear guest, you are not a registered member. As a guest, you only have read-only access to our books, tests and other practice materials.
 (request help)
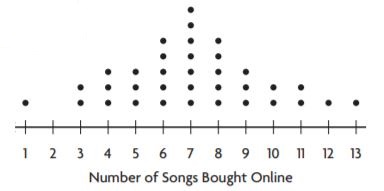
 (show solution)