×
Dear guest, you are not a registered member . As a guest, you only have read-only access to our books, tests and other practice materials.
As a registered member you can:
View all solutions for free
Request more in-depth explanations for free
Ask our tutors any math-related question for free
Email your homework to your parent or tutor for free
Registration is free and doesn't require any type of payment information. Click here to
Register .
Grade 6 HMH Go Math - Answer Keys
Please share this page with your friends on FaceBook
Share and Show
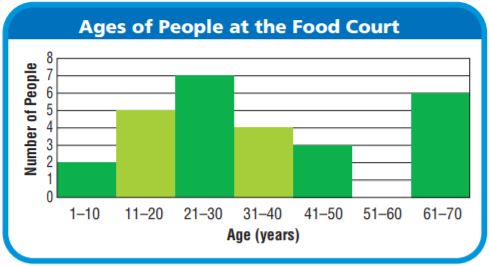
Connie asked people their ages as they entered the food court at the mall. Use the histogram of the data she collected for 1–5.
Question 1
What statistical question could Connie ask about her data?
Type below:
Question 2
Describe any peak or gap in the data.
Type below:
Question 3
Does the graph have symmetry? Explain your reasoning.
Type below:
On Your Own
Question 4
The lower quartile of the data set is 16.5 years, and the upper quartile is 51.5 years. Find the interquartile range. Is it a better description of the data than the range? Explain your reasoning.
Type below:
Question 5
Make Arguments
Type below:
 Dear guest, you are not a registered member. As a guest, you only have read-only access to our books, tests and other practice materials.
 (request help)
 (show solution)