×
Dear guest, you are not a registered member . As a guest, you only have read-only access to our books, tests and other practice materials.
As a registered member you can:
View all solutions for free
Request more in-depth explanations for free
Ask our tutors any math-related question for free
Email your homework to your parent or tutor for free
Registration is free and doesn't require any type of payment information. Click here to
Register .
Grade 6 HMH Go Math - Answer Keys
Please share this page with your friends on FaceBook
Lesson Check
Question 1
Team A has a mean of 35 points and a range of 8 points. Team B has a mean of 30 points and a range of 7 points. Write a statement that compares the data.
Type below:
Question 2
Jean’s test scores have a mean of 83 and an interquartile range of 4. Ben’s test scores have a mean of 87 and an interquartile range of 9. Compare the students’ scores.
Type below:
Spiral Review
Question 3
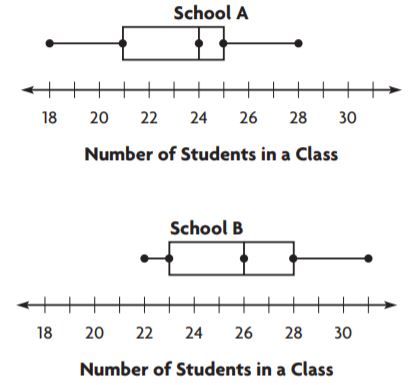
Look at the box plots below. What is the difference between the medians for the two groups of data?
Question 4
The distances in miles that 6 people drive to get to work are 10, 11, 9, 12, 9, and 27. What measure of center best describes the data set?
Type below:
Question 5
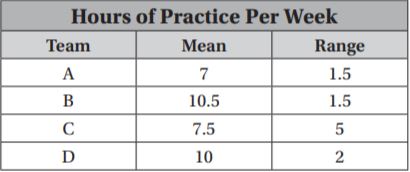
Which two teams typically practice the same number of hours, but have very different variations in their practice times?
Type below:
 Dear guest, you are not a registered member. As a guest, you only have read-only access to our books, tests and other practice materials.
 (request help)
 (show solution)