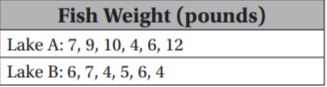
The table shows weights of fish that were caught in two different lakes. Find the median and range of each data set, and use these measures to compare the data.
Mrs. Mack measured the heights of her students in two classes. Class 1 has a median height of 130 cm and an interquartile range of 5 cm. Class 2 has a median height of 134 cm and an interquartile range of 8 cm. Write a statement that compares the data.
Richard’s science test scores are 76, 80, 78, 84, and 80. His math test scores are 100, 80, 73, 94, and 71. Compare the medians and interquartile ranges.
 Dear guest, you are not a registered member. As a guest, you only have read-only access to our books, tests and other practice materials.
 (request help)
 (show solution)