Compare The table shows the number of miles Johnny ran each day for two weeks. Find the median and the interquartile range of each data set, and use these measures to compare the data sets.
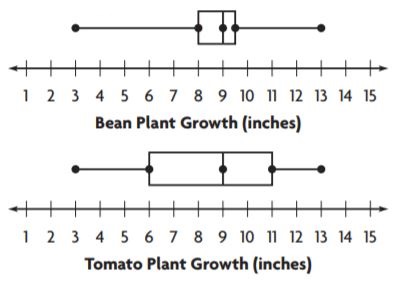
Sense or Nonsense? Yashi made the box plots at right to show the data he collected on plant growth. He thinks that the variation in bean plant growth was about the same as the variation in tomato plant growth. Does Yashi’s conclusion make sense? Why or why not?
 Dear guest, you are not a registered member. As a guest, you only have read-only access to our books, tests and other practice materials.
 (request help)
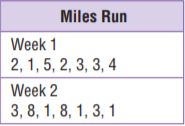
 (show solution)